
Data visualization with ECharts in an Angular project using ngx-echarts is pretty simple. In this post, I am going to share how to use ECharts in Angular projects.
Create new Angular Project
The creation of your first Angular project has become very simple because of the handy Angular CLI. Open your CMD and run the following command.
ng new your-project-nameTo explore more on how to create a new angular project click here.
Installation
Run the following npm commands to install ngx-echarts.
npm install echarts -S
npm install ngx-echarts -S
Usage
Import the package in your project’s AppComponent as shown below:
  imports: [
    ...
    NgxEchartsModule.forRoot({
      echarts: () => import('echarts'), // or import('./path-to-my-custom-echarts')
    }),

    ...
  ],
Data Visualization Using ECharts (ngx-echarts) in Angular Project
Instantiate a chart object using EChartsOption in your component TS file.
For example:
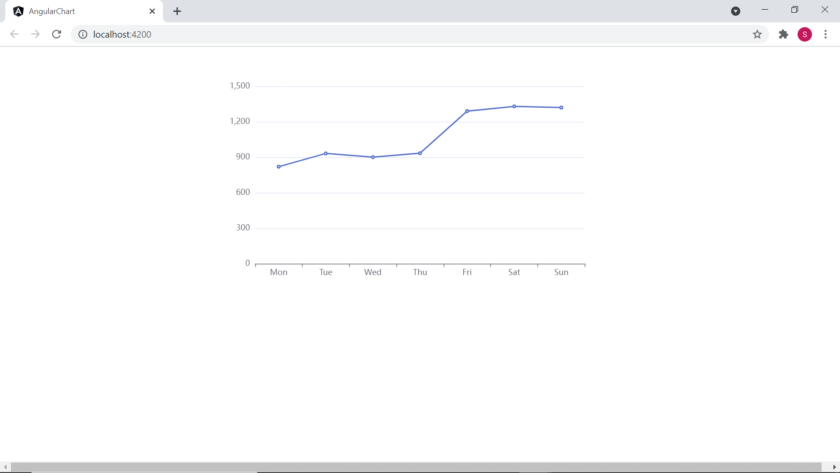
chartOption: EChartsOption = {
    xAxis: {
      type: 'category',
      data: ['Mon', 'Tue', 'Wed', 'Thu', 'Fri', 'Sat', 'Sun'],
    },
    yAxis: {
      type: 'value',
    },
    series: [
      {
        data: [820, 932, 901, 934, 1290, 1330, 1320],
        type: 'line',
      },
    ],
  };
To display it on your HTML file,
<div echarts [options]="chartOption" class="demo-chart"></div>Output
Click Here to check in my GitHub repository.